One table for every variant of a page, down to each step of its quiz.
A/B Testing 2.0 variants and quiz steps in one table 2025
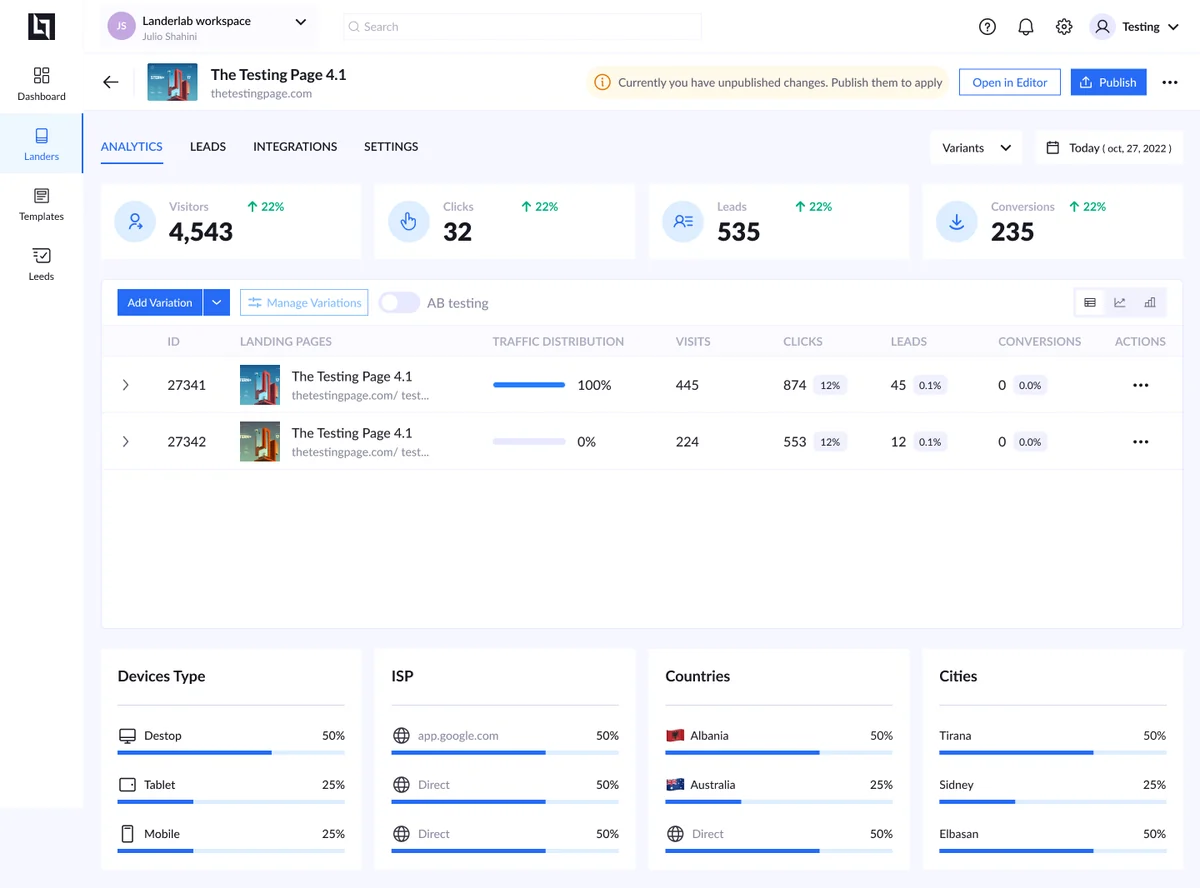
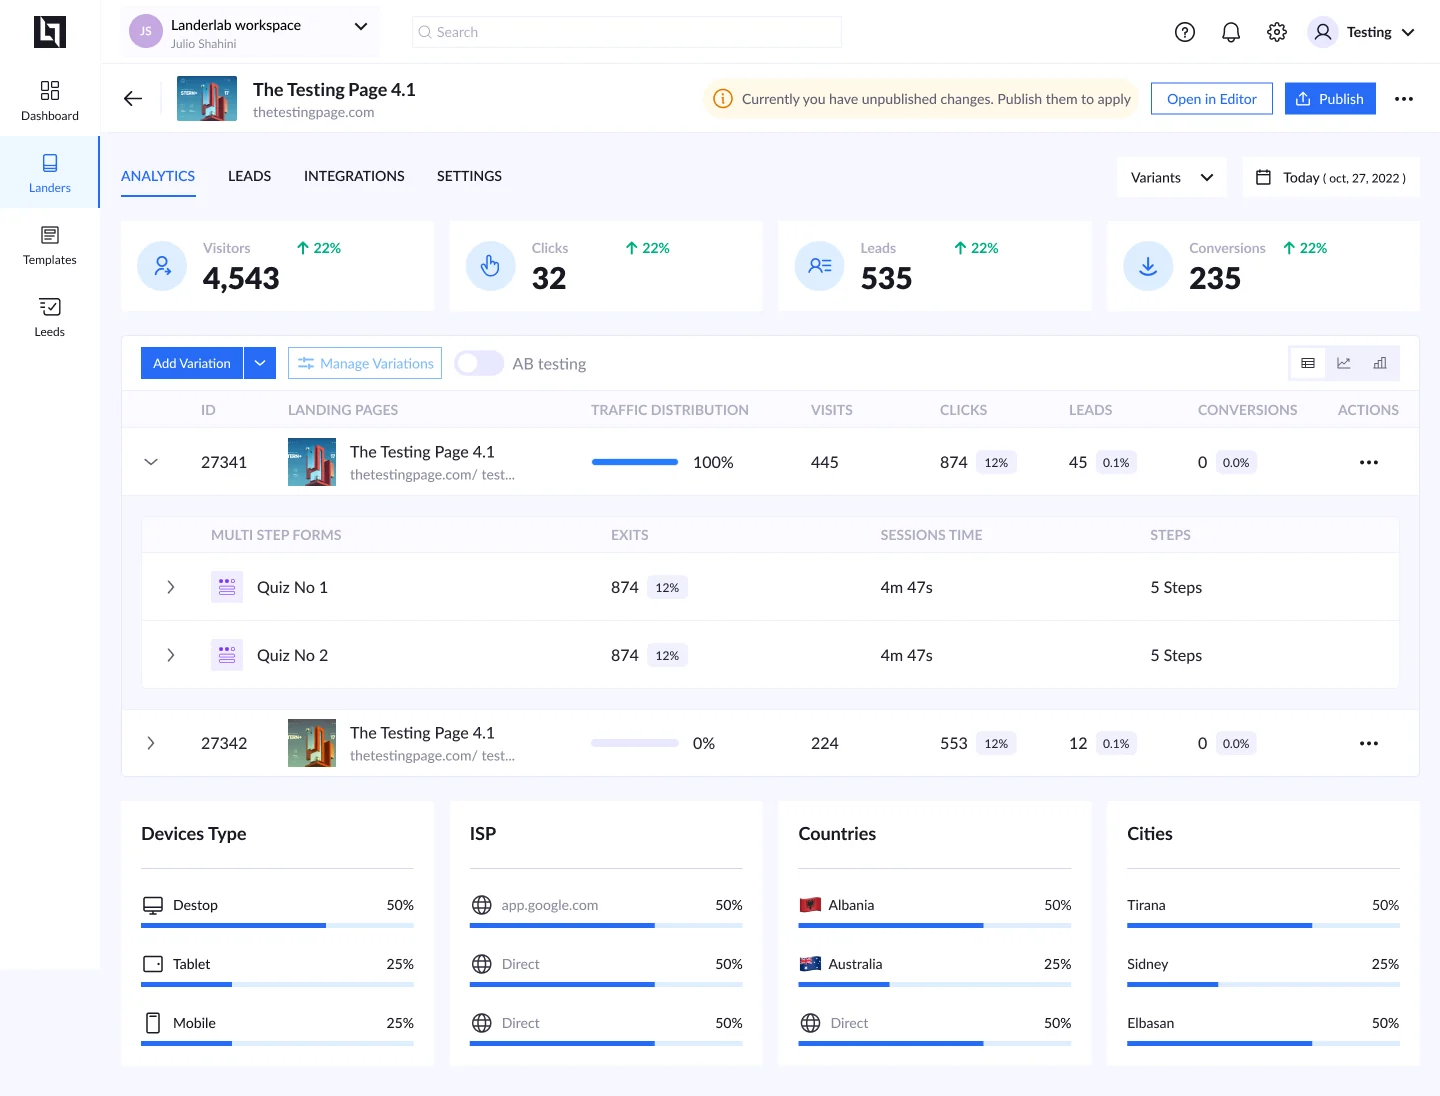
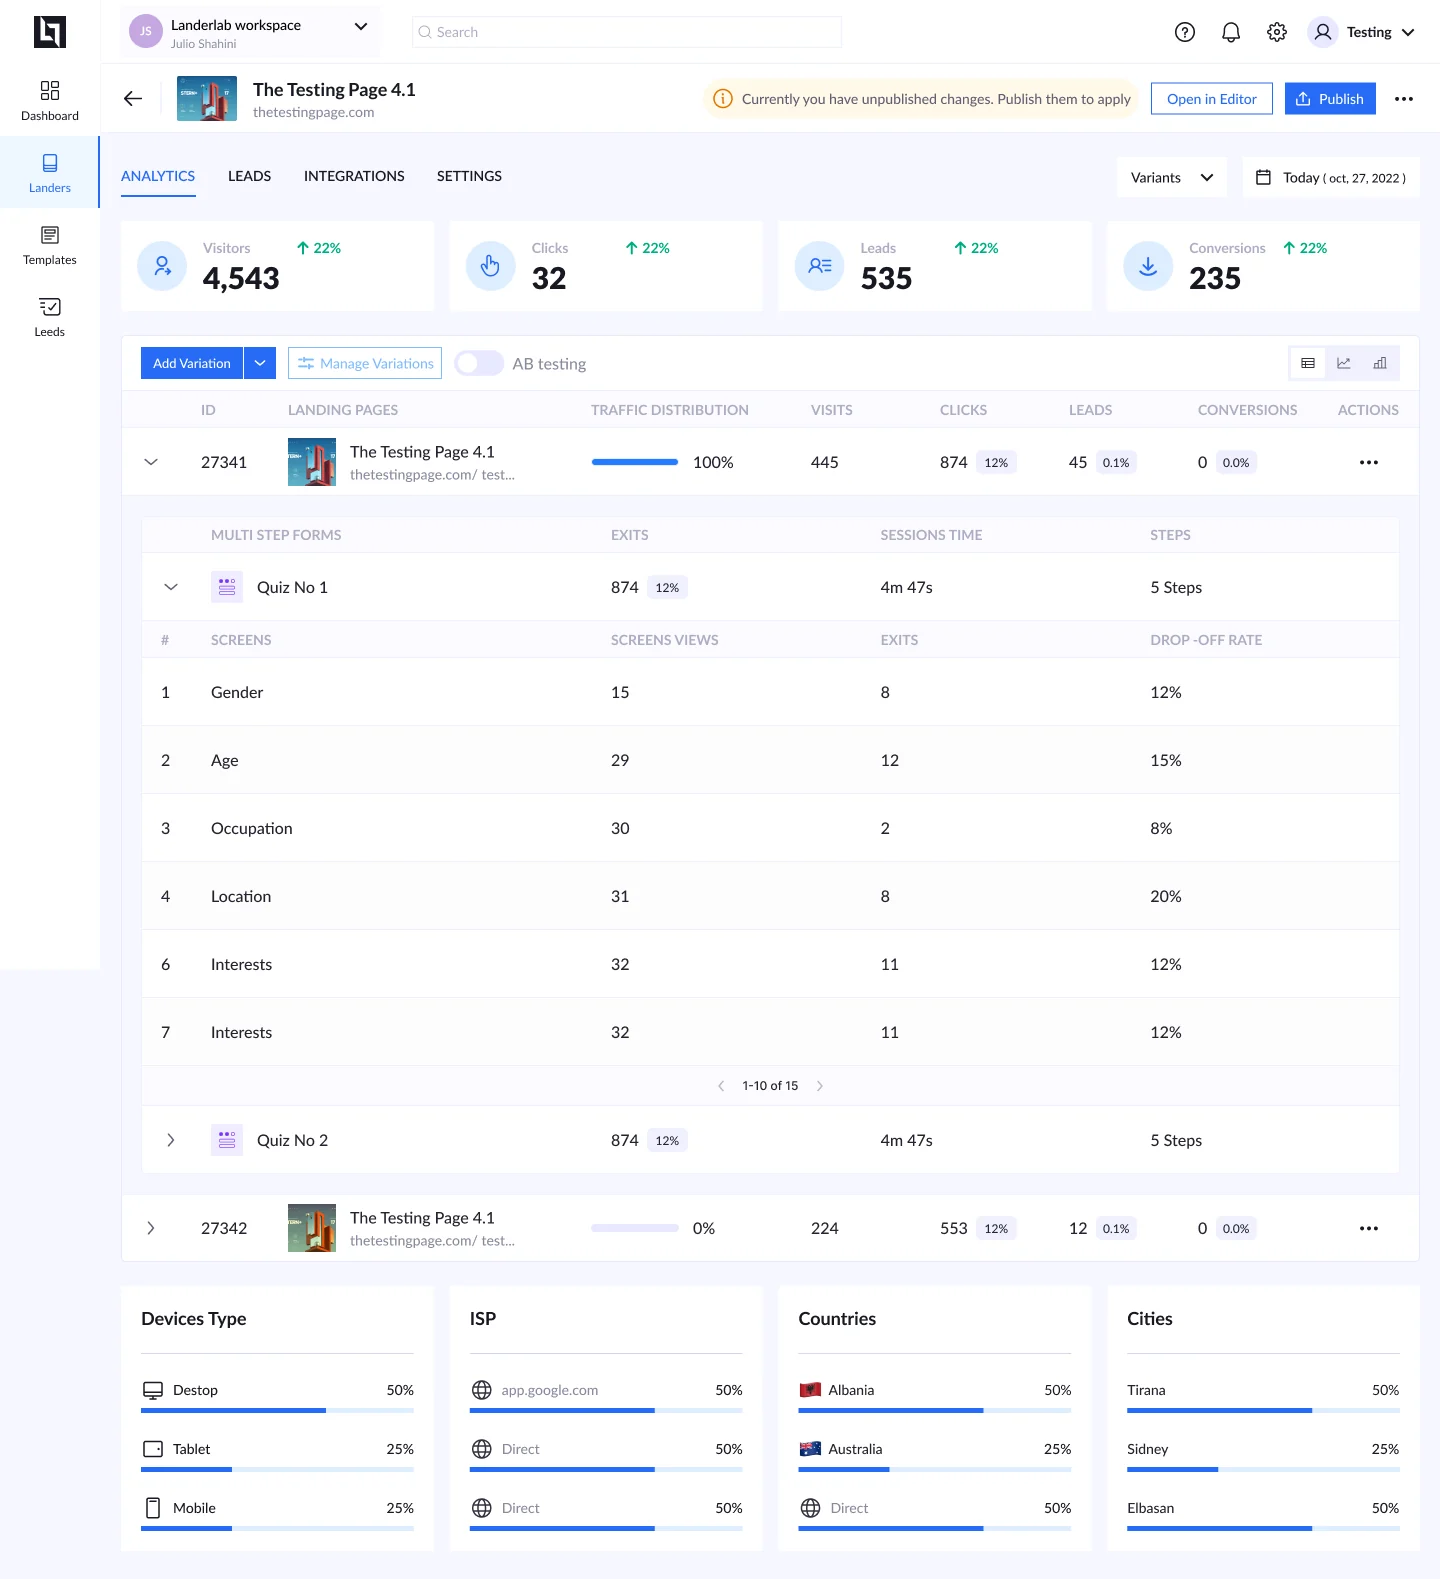
The redesign of A/B testing in LanderLab. Each variant of a landing page is one row, with its traffic split, visits, clicks, leads and conversions. Open a row to see its quizzes, then open a quiz to see where people leave it, step by step.
- Discipline
- Product design · Data viz
- Year
- 2025
- Part of
- Product design
- Tags
- SaaS, A/B testing, Analytics
One table, three levels
Variants first. The traffic split sits right in the row as a bar, next to visits, clicks, leads and conversions.
Then the quizzes. Open a variant to see the multi-step forms on it, with exits, time spent and the number of steps.
Then each step. Open a quiz to see how many people saw each question and how many left there. The drop-off rate shows where the quiz loses people.
Around the table
The basics on top. Visitors, clicks, leads and conversions, each with its change, stay above the table on every view.
Who each variant reaches. Cards for device, ISP, country and city sit under the table.